
Twitter and Facebook are waging the auto-play/click-to-play/can’t-make-up-their-mind video war, pitting video view ad types against each other and promising the forbidden fruit of endless engagement.
Marketers are stationed on the front lines, chasing ever-changing view models through the jungle with hopes of coaxing campaign goals and KPIs into the crosshairs.
Understanding the fundamentals of each view type, campaign type and reporting metric is crucial to surviving the battle. This blog series will first delve into the Facebook video view campaign, with an emphasis on performance metrics.
Then, stay tuned:, Twitter will be examined for its video view campaigns and reporting capabilities. To wrap, the main event will bring you a Facebook v. Twitter comparison and the ability to gauge performance across channels.
Facebook debuted its paid Video View campaign type in 2013, running auto-play right out of the gate. YouTube’s reign was still strong with 21.2%of the US digital video ad market. Boasting 6 billion hours of content watched each month, 2013 saw YouTube as a global video powerhouse.
Facebook’s video presence grew, leveraging its data high-ground and appealing to marketers with unrivaled demographic and psychographic information. Enter 2015, and 70% of videos on Facebook were being uploaded directly to the platform. With 4 billion views per day, Facebook had reached fighting weight and was going pound for pound with YouTube.
Content was the currency in this battle royale, and Facebook delivered a devastating blow when announcing the social giant would be sharing revenue with video advertisers. Similar to the YouTube model for channel owners and content creators, Facebook indicated it would keep 45% of the revenue generated from a video ad. Luring big brands and YouTube stars away from the video godfather, Facebook’s blast radius was knocking on Google’s door.
Video View Ads
Facebook’s video view ad type is virtually pain free to set up and delightfully simple to manage.
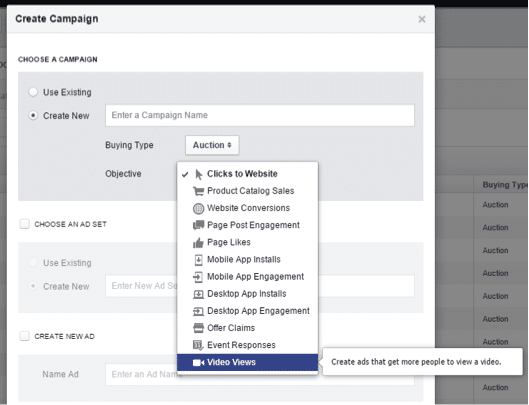
Select Video View when creating a new Facebook campaign.
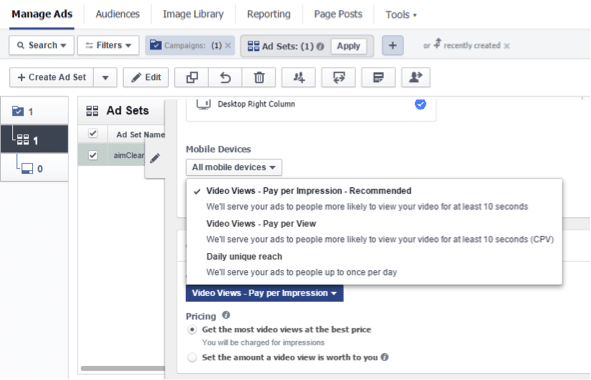
Toggle between pricing structures based on campaign KPIs.
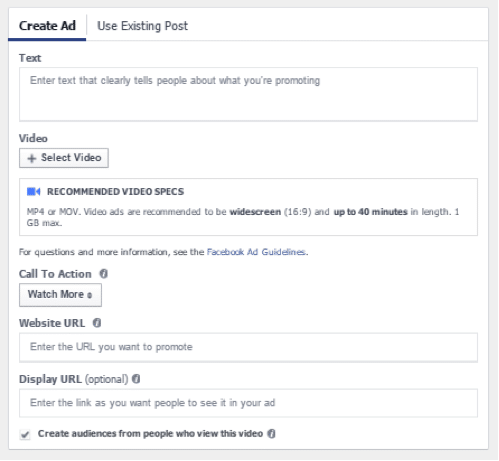
Upload a video, create a call-to-action, and launch your content to 1.44 billion monthly active users.
With abundant how-tos and creation deep dives, the real bread and butter comes when analyzing the success of a video view campaign. Luckily, Facebook doesn’t skimp on the hearty servings of data for marketers to digest.
Engagement – The Holy Grail of Paid Social
At the root of engagement is an engaged user. To define an engaged user, a marketer needs to understand what level of engagement qualifies as engaged. There are many different metric crayons in the color box, but selecting each crayon to create harmony takes a Picasso.
Actions. A slightly sketchy metric that takes into account ANY action a user takes with an ad or after interacting with an ad. Liking a post, clicking on a website link or choosing to view the page the ad was posted from all measure up as “actions.” Understanding every interaction with an ad is important to determine behavior, but there are ways to gauge engagement at a more granular level that doesn’t involve a grab bag of miscellaneous engagement.
Soft Engagement vs. Hard Engagement. It takes a simple puppy trick or baby’s-first-lemon video to entice a “like” out of a user. In the B2B or B2C world, it takes innovative and authentic content to seduce a share or website click. Examining which engagement metrics play towards your campaign KPI will allow you to zero-in on your target and develop an understanding of success.
For example: a video view campaign driving app install for the New York Times on a mobile device…
Soft Engagements
- Likes
- Comments
- Page Likes
- Video View
Hard Engagements
- Shares
- Video Views to 75%
- Video Completions
- Website Clicks
- Mobile App Installs
LAND MINE: Set up engagement Goal Tracking on your landing page. Fire when a user is on-page for 2 minutes or more; or scrolls past 50% of the page. Then segment by source and include the new users from Facebook in your engagement secret sauce.
Views – Hitting a Moving Target
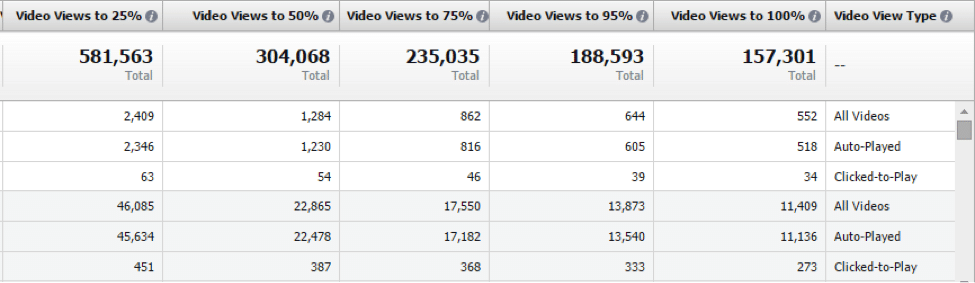
When understanding video campaign performance, most marketers head straight to views. Knowing the simple definition of a “view” is crucial to understanding success. Facebook defines video views as the number of times a video was viewed for 3 seconds or more. YouTube data nerds understand that view length is the real hero when gauging user engagement. Facebook fills that need by presenting the number of views at different lengths.
How long should my video be? It’s the holy grail of video content questions. Wistia examined video length engagement by %viewed and found that size (errr… length) truly does matter.

For videos under one minute, average audience retention increases by 40%.
Taking into account the length of the promoted video and the %viewed, marketers begin to have a solid foundation for measuring performance. By only examining a set %viewed instead of all video views, additional views noise is ruled out. This is where defining an engaged user is tied to a specific metric. With a 1-minute video, users that make it to 50% are, by YouTube’s definition, a qualified viewer. With a 3 minute video, any user that makes it past 25% could be defined as a qualified viewer. The sweet spot comes with knowing, at what point, the promoted video drops the KPI bomb. If a viewer watches past ground zero, they are THE engaged user. Report on engagement for video views to that point and chart performance over time.
EPMI
Imagine a report pivot that takes app installs, video views to 75%, shares, and website clicks — and boils it down to one magic engagement number. Engagements per thousand impressions (EPMI) allows marketers the ability to roll-up qualified engagement to compare across campaigns, ad sets, channels and platforms. EPMI takes the punch of CTR with a CVR roundhouse.
Example: our old friend, the video view campaign driving app, installs for the New York Times on a mobile device with a 45 second video.
EPMI=(((Shares + Video Views to 75% + Website Clicks + App Installs)/Facebook Impressions)*1000)
Example: an awareness video campaign announcing Donald Trump’s 2016 presidential run with a one minute video and a surprise twist at the 58 second mark
EPMI=(((Likes + Comments + Shares + Page Likes + Video Views to 50% + Video Completions)/Facebook Impressions)*1000)
LAND MINE: Chart a campaign’s EPMI growth on a yield curve and project the point that total spend will make CPE the most cost effective. Present the curve to your stakeholders and watch your campaign pockets grow deeper.
With Facebook reporting over 3 billion video views per day, video advertising to 890 million active users seems to be a KPI no-brainer. Reporting EPMI for video campaigns with truly delicious engagements, is a marketing main course for all stakeholders.
But with a new dawn comes a new day and a new enemy on the horizon.
Next up: Twitter paid video campaigns and how to gauge performance hand grenade to hand grenade; for a winner take all Internet battle.
Stay tuned.


