

Introduction
Like anything cool, PPC display placements are aggregated data targetable in layers. It’s important to appreciate, logistically, how these layers impact reports and how to employ the data as a tactical advantage.
Analogy
Let’s use the familiar analogy of a warehouse that stores and ships kittens. Our campaigns are the warehouse, and adgroups are sectors in the warehouse:
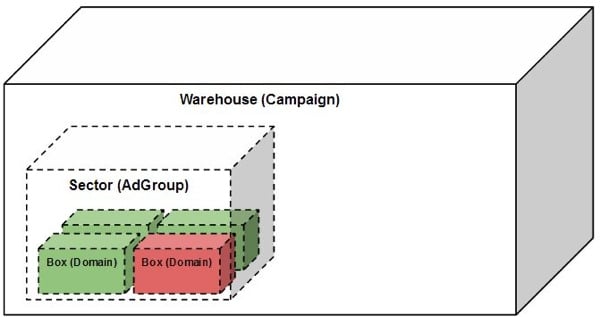
- In the sectors we store kittens
- The kittens arrive in boxes.
- These boxes are the domain and kittens are the URL:
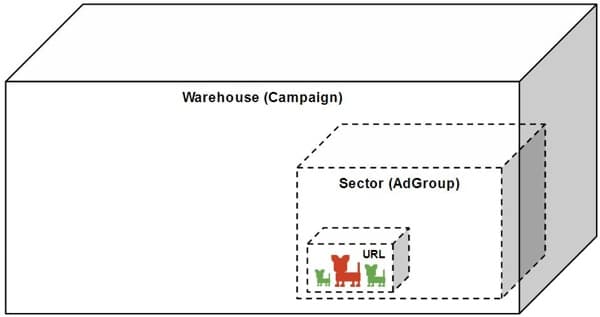
Have a look at how all that comes together:
Each kitten has its own identity, same with the box they come in.
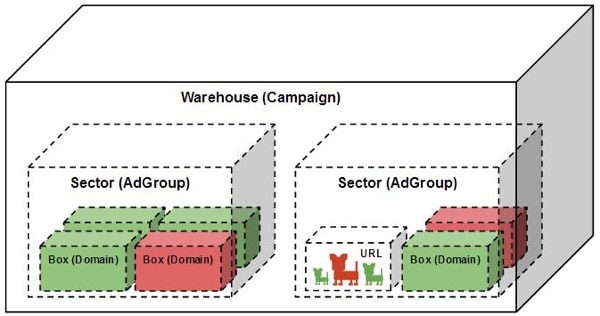
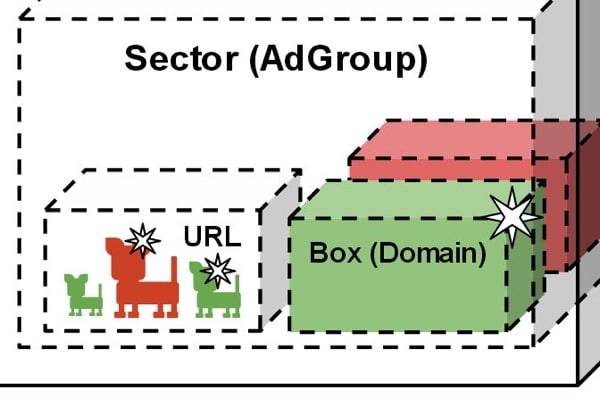 It’s possible for boxes of kittens to appear in multiple sectors.
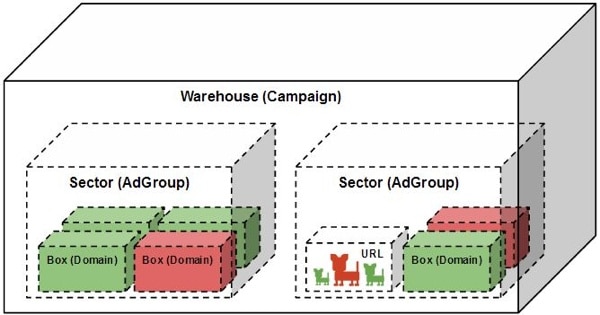
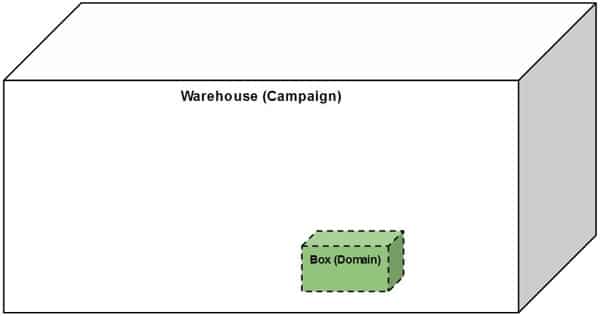
Summarized, warehouses (campaigns) store boxes (domains) of kittens (URLs) in sectors (adgroups). The image below illustrates how things fit together.
This is what the system looks like as a pivot table in excel:
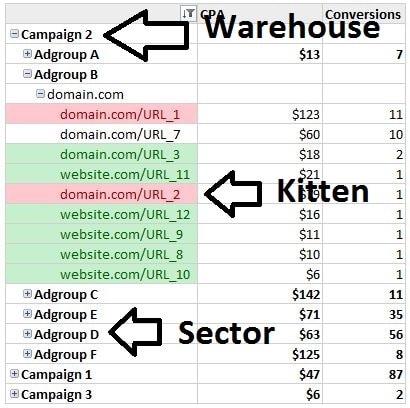
As a kitten sits around, it costs money. We want our kittens to be adopted (a conversion). We can tell how popular a kitten or box of kittens is.
Knowing the way the factory is organized and how to focus on the most adoptable/unadoptable kittens is the name of the game. This is best done with isolating and aggregating. Find enough data to make decisions with aggregating. Look at your kitten data more specifically with isolating.
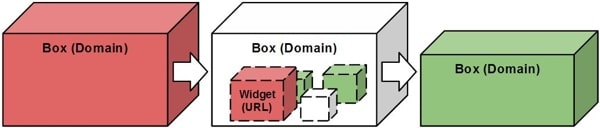
A bad kitten can make a good box look bad
It’s easy to look at the data from a box of kittens and say, “Nobody wants to adopt these little jerks.”  (I hate when that happens) Let’s not diss those kitties, not just yet.  It’s important to look inside the boxes and make sure there isn’t one singular smelly kitten making the rest look bad.  These kittens are your best-bet negative placements:
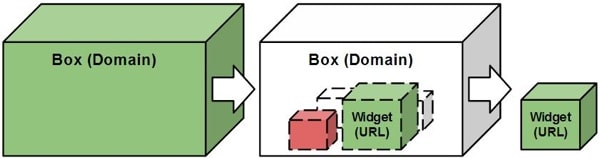
A great kitten can make a mediocre box look good
Sometimes a box looks great, but in reality it’s one stellar kitten doing all the work.  These kittens are your best-bet managed placements:
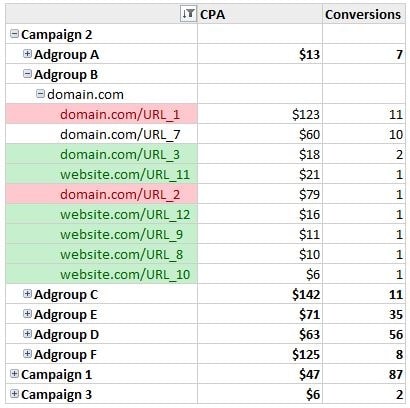
Here’s what this looks like in a pivot table with real data:
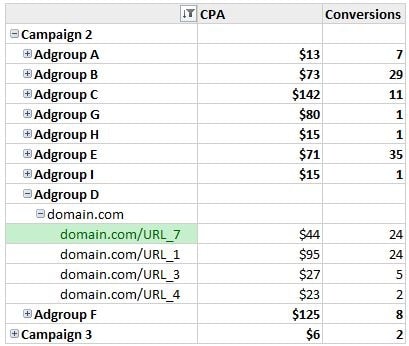
URL by adgroup (Kitten by sector of the warehouse)
Start here if you can. If you have enough data, this is where you’re going to make the most accurate decisions.
As a pivot table:
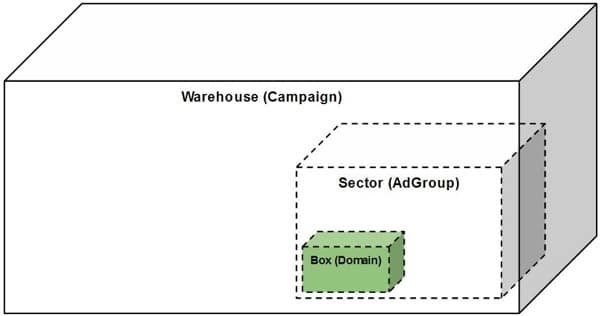
Domain by Adgroup (Box of kittens by sector of the warehouse)
Not enough meat on the bones at the URL level? Too much data to sift through? This might be the level for you. It’s less precise than looking into the boxes, but the rolled up numbers can be useful.
As a pivot table:
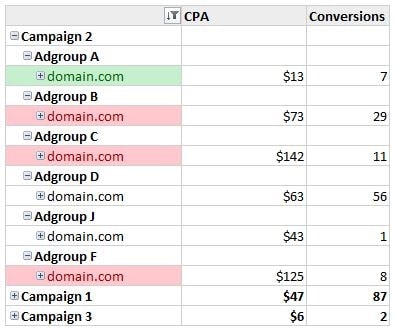
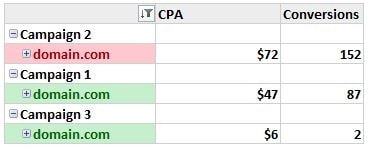
Domain by Campaign (Boxes of kittens ignoring the sector of the warehouse)
Perhaps there are not major differences between your adgroups. Perhaps there’s just not enough data and you need to start taking action.  This is actually a pretty common level to add managed and negative placements. It’s not very precise but it is easy to find and will often have high traffic volume.
As a pivot table:
Conclusion
Placements are a hodgepodge of moving parts that come together to make a display network presence. There is order to the madness and it can be clearly defined. Having a complete understanding of this system will give you the confidence to be creative with your data.
Since this information is based on the building blocks of PPC accounts and website structures, it should be relevant to most display networks for a while to come. There is a lot of money to be made here. Happy Warehousing!


