

Recently, I had the pleasure of speaking at #SMX East, on a panel that focused entirely on SEO KPIs (Key Performance Indicators). As search engine optimization has become inexorably intertwined with social media and universal SERPs, so too has the spectrum of goals diverged from keyword-traffic-only-measurements marketers looked to in days of old. In the true spirit of K.I.S.S. (Keep It Simple, Stupid), we set out to reduce classic and potential KPI data points to a streamlined chart, expressing a matrix of analytic possibilities.
At AIMCLEAR we use this chart to spawn creative thinking as we construct new SEO metrics that reflect evolving SEO realities. From the most basic traffic KPIs to multi-level social/SEO mashups, brainstorming on this grid of analytic options is of benefit to our team. A look at how to construct KPIs follows.
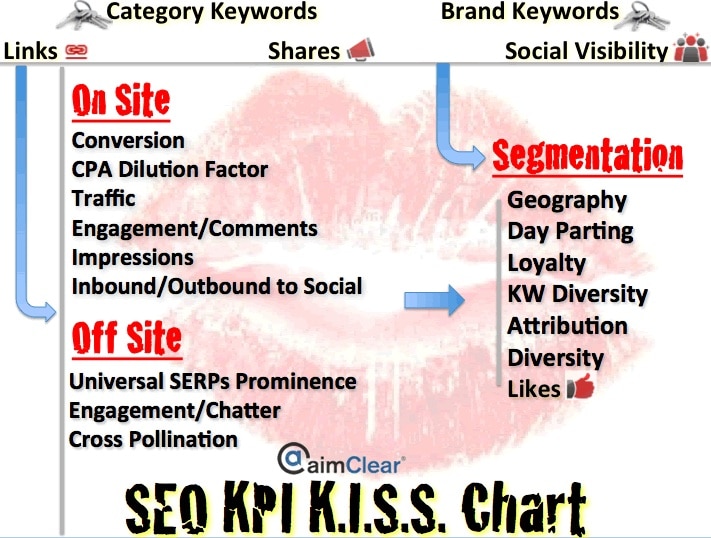
Fundamentals, Top Down Start with five variables above the gray line: category keywords (non brand), brand keywords, links, shares and social visibility. All of these building blocks can result in traffic.
Path One: Straight Down To The Left Or To The Right
Follow the arrows to either the left or right from the building blocks to “On Page,” “Off Page” or “Segmentation” to form KPIs, a sampling of which includes:
- Brand keyword conversion
- Category keywords by geographic location
- Shares (in social media) that lead to impressions in the organic SERPs
- Category keyword traffic that results in traffic
- Links resulting in engagement and/or chatter
- Social visibility that results in loyal visitors (who return often)
- Links that drive traffic that leaves the site outbound to social
- Shares by time of day
- Increasing diversity of category keywords
Path Two: Left Then Right
Follow the arrows down to the left and then to the right. This yields SEO KPIs that are more complex, including:
- Shares resulting in conversion segmented by geographic area
- Converting category keywords that dilute the CPA (because to buying those keywords are very expensive) by time-of-day.
- Social visibility that cross pollinates to other channels that result in likes
- Links to off site properties (like YouTube) that boost organic prominence in Universal SERPs for Geographic specific keywords.
- Engaged traffic from link referral traffic that converts later via search PPC, as evidenced by measuring attribution.
There are 640 possibilities on this this chart, many of which are already widely adopted. Others range from innovative and immediately useful to more theoretical expressions.
Creating mechanisms to report on some of these KPIs is an interesting matter. Some combinations are super easy to conceptualize and execute in Google Analytics, using Advanced Segments, and other analytic packages. Others require more sophisticated systems, are difficult to isolate or even impossible to measure except for “feeling” lift.
There is no be-all-and-end-all KPI-construction solution. We don’t hold this chart out to be perfect and would welcome ideas and contributions to rearrange the variables we chose or add others. The idea is to get those creative KPI juices flowing. We hope you enjoy this chart as a starting place for creative SEO KPI thinking!


