Facebook Ads, “Advertising Performance Reports” are the primary analytics marketers use to optimize FB Ads campaigns and create reports. Over the last few weeks, and through the May 25th UI update, our AIMCLEAR team thoroughly researched available optimization metrics, what they mean, where they appear, and at what access points they are editable live in various screens. The process reminded us of reverse engineering an octopus. Simply stated, some of the most insightful analytic attributes available, are not available at a point where FB Ads account are editable for optimization. Therefore, knowing what metrics are available, where to access them, and what they mean, is crucial because you’re going to have to build spreadsheet applications to figure things out.
The results of our study, along with tons of insight and optimization recommendations, are detailed for release in our upcoming Wiley/Sybex book about Facebook Ads (“Killer Facebook Ads”), which is scheduled for release at SES San Francisco. As SMX Advanced Seattle and All Facebook Summit approach, we want to share top line results with the online marketing community, by way of this handy guide. Below the chart, we explain what data screens comprise the chart, how to read the grid, and what each Facebook metric basically means.
For advanced marketers, we think the, “Connections” metric is the biggest takeaway, because it’s a new internal metric, which can be used for tracking internal conversion to internal FB assets. Also, we should mention that other Facebook Ads reports, “Responder Demographics” and, “Responder Profiles” can be very useful for optimization purposes. This post focuses on the, Advertiser Performance Report, because it is the root data for the FB Ads Manager UI.
(You may need to open your browser up wider or zoom out to view this entire chart)
| * = Editable | All Campaigns UI HTML | All Campaigns Full Report HTML | All Campaigns Full Report Exported to .csv | (Individual) Campaign UI HTML | All Ads UI HTML | All Ads UI Full Report HTML | (Individual) Campaign Full Report HTML | All Ads UI Full Reports Exported to .csv | (Individual) Campaign UI & All Ads UI Full Reports Exported to .csv |
| Metrics | |||||||||
| Campaign (Name) | X * | X | X | X * (Campaign Only) | X | X | X | X | X |
| Notifications & 5 Day Spend | X | ||||||||
| Audience & Response Graphs | X (Campaign Only) | ||||||||
| Campaign ID | X | X | X | ||||||
| Ad Name | X *(Ads Only) | X * | X | X | X | X | |||
| Ad Id | X | X | |||||||
| Status | X * | X * (campaign & ads) | X * | ||||||
| Start Date | X | ||||||||
| End Date | X | ||||||||
| Date or Date Range (Current View) | X * | X * | X | X *(ads’ view) | X * | X * | X * | X | X |
| Duration (Start Date & End Date) | X | X *(campaign only) | |||||||
| Budget | X * | X *(Campaign Only) | |||||||
| Remaining | X | ||||||||
| Spent | X | X(Account & Individual Campaign) | X | X (campaign only) | X(Account & Ads) | X (Campaign & Ads) | X | X | |
| Bid | X *(Ads Only) | X* | |||||||
| Price | X(Ads Only) | X | |||||||
| Impressions | X(Account & Individual Campaign) | X | X(Account & Ads) | X (Campaign & Ads) | X | X | |||
| Social Impressions | X | X | X | X | |||||
| Clicks | X(Account & Individual Campaign) | X | X (campaign & ads) | X | X(Account & Ads) | X (Campaign & Ads) | X | X | |
| Unique Clicks | X | X | X | ||||||
| Social Clicks | X | X | X | X | |||||
| CTR | X(Account & Individual Campaign) | X | X (campaign & ads) | X | X(Account & Ads) | X (Campaign & Ads) | X | X | |
| Unique CTR | X | X | X | ||||||
| Social CTR | X | X | X | ||||||
| CPC | X(Account & Individual Campaign) | X | X(Account & Ads) | X (Campaign & Ads) | X | X | |||
| CPM | X(Account & Individual Campaign) | X | X(Account & Ads) | X (Campaign & Ads) | X | X | |||
| Reach | X | X (campaign & ads) | X | X | X | ||||
| Social Reach | X | X (campaign & ads) | X | X | X | ||||
| Social % | X | X | X | ||||||
| Frequency | X | X (campaign & ads) | X | X | X | ||||
| Connections | X (Account Only) | X | X (campaign & ads) | X | X(Account Only) | X (Campaign Only) | X |

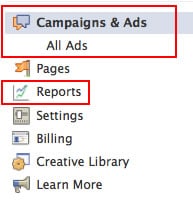
Clicking on “Campaigns & Ads” brings you to a list of all campaigns in the account. Clicking on any individual campaign brings you to the (individual) “Campaign” screens. “All Ads” is a list of all the ads, account wide.
Each of the three main screens is essentially a lighter preset version of the, “Advertising Performance Report,” also available with many more options via the, “Reports” module. What makes these Ads Manager screens unique is that some (and I mean some) attributes are editable, to facilitate optimization. Knowing which attributes are editable where can be something of a Rubik’s Cube. There are important missing pieces, like the ability to easily live-optimize campaigns, account wide, side by side.

Clicking the, “Full Report” button from each of the main Ads Manager UI screens, calls a deeper HTML version of the same Advertiser Performance report, culled from the, “Reports” module. Look to the left sidebar and you’ll see that now you’re actually in the reports module. Non of these attributes are editable for optimization purposes, but additional data is available. Each of the Full Reports, include options to, export the report to .CSV, each of which includes even more metrics in a deeper spreadsheet version, again, of the same root report.
How To Read The Chart Above
From left to right along the top, we’ve listed each of the three main UI HTML screens, their Full Reports and each Full Report’s .CSV Export. The final column to the right is for the .CSV export for both the (individual) “Campaign” and the, “All Ads” .CSV export, because they are essentially the same.
The left hand side of the chart lists metrics available in the main Ads Manager UI screens, their Full Reports and Exports. * means that the attribute is editable live for optimization. Where attributes are editable and where they are not, is key for optimizers. Please note that some UI screens have attributes which can be viewed or edited at multiple levels of account hierarchy. For instance in the (individual) Campaign screen, CPC is visible at both the campaign and individual ads levels.
What The Metrics Mean
OK, let’s dive into the metrics themselves. As an upfront, just because FB says a metric is supposed to exist, does not mean it works. For instance the, “Conversion” metric is retired, as FB does not offer native conversion tracking for external pages any longer. Campaign Name, Ad Name, Clicks, CTR, Impressions, CPM (Cost per thousand impressions) require no explanations. The following metrics deserve mention and/or a bit of clarification.
Connections
Tracking conversion to internal FB assets is possible with Facebook’s newly released, “Connections” metric. Connections replaces the retired Actions metric. If you’re not routing your ad or sponsored story to an internal FB asset (Page, Event, or App) you won’t have any Connections data.
Audience & Response Graph

The brand new circular, “Audience” graph provides relative visual representations of:
- How many people the campaign targets (“Targeted”)
- How many unique people saw your ads (“Reach”)
- One way that FB Ads support socialization of ads is to display the names of users’ friends who engaged with FB assets you’re marketing with Facebook Ads. “Social reach” is a proprietary FB metric which shows, “People who saw your campaign’s Sponsored Stories or ads with the names of their friends who liked your Page, RSVP’d to your event, or used your app. If you’re not using Sponsored stories or advertising a Page, event, or app, you won’t have social reach.
Roll your mouse over either the Targeted, Reach, or Social Reach circles in the Audience graph, to see the exact count of users that comprise the circle.
The “Response” graph shows a line graph for the last 28 days of:
- How many total clicks your ads garnered (“Clicks”).
- FB describes as “The number of users who liked your Facebook Page, RSVPed to your event, or installed your app within 24 hours of seeing this Sponsored Story or ad. If you’re not promoting a Page, event, or app, you won’t see impressions Time data.”
Reach
How many unique FB users saw your ad.
Social Reach
When a FB user sees an ad impression, marketing to an internal FB asset that any of their friends interacted with, the ad has an extra caption highlighting which friend(s) Liked, RSVP’d or used the app’. “Social reach” shows, “People who saw your campaign’s Sponsored Stories or ads with the names of their friends who liked your Page, RSVP’d to your event, or used your app.
Frequency
Brand marketers will love this new metric. Frequency is how many individual users, in your targeted segments, saw your campaign or ad. Frequency really means unique impressions.
Status
Sort by campaigns or ads that are running, paused, scheduled dates and those deleted or completed. When editable, click the downward-facing triangle to pause an ads or campaigns, make them active, or delete them. When editable, this is an important optimization attribute.
Bid
How much you’re willing to pay for a click or by CPM. The only notable factor about bids, is that you can only bid at the ad level, and not the campaign. When editable, this is a prime optimization attribute.
Price
For CPM ad, this really means average CPM- the average cost per thousand views. For CPC ads, this really means average CPC- the average cost you paid per click. -Spent
Start Date
Edit or sort campaigns by their start date and whether they are running continuously (ongoing), paused, completed, or deleted.
End Date
Edit or sort the end date for scheduled campaigns or by those running continuously (ongoing).
Date Range
Refers to the time period you’re currently viewing in an Advertiser Performance Report. When editable, this attribute lets you changes the time period for which you’re viewing the report.
Remaining
Money remaining in today’s daily or lifetime budget for a campaign
Spent
The total amount spent on the campaign for the time period selected
Budget
Facebook Ads have several budgeting points, including the daily limit set by FB and a lifetime budget advertisers can set. The attribute in Advertising Performance Reports speaks to daily campaign budget, either as set by the day or automatically metered our over the shelf life of a scheduled campaign. When editable, this is a key optimization attribute.
Campaign ID and Ad ID
Facebook assigns unique identification number to campaigns and ads, thus the, “Campaign ID” and, “Ad ID.” This attribute, only available by .CSV export, is useful for building API and spreadsheet (bulk upload) applications.
Unique Clicks, Unique CTR
The unique statistics take into consideration that a single person may click an ad multiple times and that person is counted as only one click in the unique metrics.
Social Impressions
Facebook has described this metric as, “How many times your ad was displayed along with social context surrounding the viewer’s friends who have connected with your page, event, or application.” While this metric still appears on some reports as of this writing, FB appears to be renaming it, “Social Reach.”
Social %
Facebook has described this metric as, “Percentage of overall impressions that included social impressions.” Keeping in mind that, “Social Reach” means how many users saw your ad with friends’ names, “Social %” is the percentage of users who saw the ad in social context.
Social Clicks
How many clicks resulted from Social Impressions (Social Reach). I love this metric because it clearly demonstrates if there is any value to  serving ads in social context.
Social CTR
The social click rate is the percentage of Social Impressions (Reach) that result in social clicks
Wrapping Up
Of Course, there’s much more to say about these metrics and FB Ads reporting. We hope you find this guide a useful aid in your optimization and reporting work. Feel free to reach out with any questions or comments and happy Facebook advertising!


