

Bottom line? Utilizing and understanding the analytic data behind your website traffic is absolutely essential if you plan on making money. The Introduction To Analytics session at Search Engine Strategies New York left the audience with a depth of courage to explore Google Analytics (GA), five elements of a CEO-worthy report, the best KPIs to measure and incorporating other analtyic data and tools from diverse sources.Â

Moderator, Jeff Ferguson, SES Advisory Board & Senior Director, Online Marketing, Local.com introduced the solo speaker John Marshall, SES Advisory Board & CTO of Market Motive. Marshall ended up in Online Marketing by accident and hated the primitive tools for the early web years so he started a little known company called ClickTracks and developed the Overlay Report to see where people click on your site. (Psst! You can find it now in Google Analytics)
I Feel Your Pain… (but quit whining!)
- If only we had more reports.
- If only the data was more accurate.
- If only IT could tag the pages.
- If only I didn’t NEED to tag the pages.
Sorry, there is no one-size-fits-all when it comes to web analytics. (But, that’s a good thing!)
5 Elements of a Great Analytics Report:
- Key Performance Indicators (KPIs)
- Segments
- Context
- Other sources of data
- Bring it all together
These are not a prominent and for a reason… so you can custom tailor analytics to your own business!
Element #1 – KPIs
- Key Performance Indicator (fyi “hits” are pretty much useless)
- CEO should understand them
- 3-5 works best
- Traffic? (no, no, no)
Marshall’s Favorite KPIs
- Bounce Rate
- Conversion rate
- Average time on site
- Task completion rate
- Share of search
- Profit per visitor
The last 3 are a little more complicated… Not much insight in GA
Measure Task Rate- use a 4Q survey, they are quick, simple and very insightful.
- What is the purpose of your visit to our website?
- Were you able to complete your task?
- If you were not able to complete your task, why not?
Surveys tell you why things happen.
- Web analytics can only tell you what happend
- Give users the chance to enter open text
Share of Search
If traffic is rising slower than the rate of searches, um, well, you’re traffic is actually going down because it’s not rising as much as search. So, yeah, sorry… re-cork the wine and save it for another day.
Profit Per Visitor
- Beware of ROI (cost of goods! DOH! Google Analytics has no clue about your COG)
Element #2 – Segmentation
- What it’s not
- What it might be, depending how you look at things (especially if you come from traditional direct marketing)
- Segment based on intent, buying v. researching (Don’t disregard those who exit without converting)
- Segment your exits (ie hotels: people who are interested in weddings probably aren’t booking online…)
Google Analytics – Advanced Segments – Jackpot!

Analytic Segments Abound!
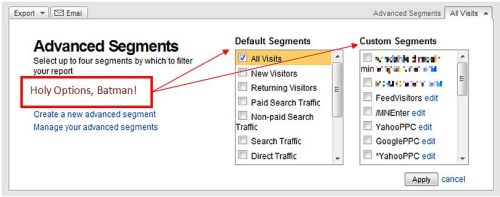
5 Segment Ideas:
- New v. Returning
- Keywords: brand v. product
Element #3 – Context
- Annotations (right under the graph)
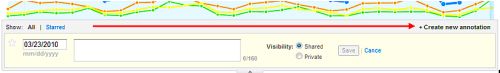
- Persuasive copy with supporting facts (some people do actually like to read)
Element #4 – Multiple Sources of Data
- Not everything is in GA
- Social Media (Not easy to measure, commercial tools are best: TrackUr or Radian6)
- RSS (aka your blog – key metric = number of subscribers. You should be using Feedburner, like, now)
- Video Playback (If you host your own, Flowplayer has a GA plugin, but you need to call up IT to hook you up)
- Event Tracking
- YouTube Insights
- AB Testing
Element #5 – Bring It All Together
- Make reports brief and insightful
- Use facts not opinions
- Scannable text with details
- Data from multiple sources
- Stitched together in one single e-mail
- Significant human effort is required (get over it and allocate resources)
- Lovingly hand-tooled works best 🙂
Ok, so you’ve spent painstaking hours generating beautiful analytics reports, what happens to them?
The Agency
- Uses reports to explain economic impact of events
- And the consequences of inaction
Bonus Element: Read any book by Avinash Kaushik
Spend Money on Training, Augment with Free Resources
- Web Analytics Association
- Web Analtyics Wednesday real life social networking/commiserating for web analysts
- Twitter: #measure
Marshall’s Top Tops
- More reports wont help
- Decide which analytics work best for your business – for entertainment, decision making, job justification
- You need help from IT
- Install WASP to Firefox to view any website’s analytics tags (stealth!)
- CLICK AROUND! You can’t break anything in GA
- Offline Conversion? Use time on site, it’s a solid indicator


