
 We’ve been deploying Facebook Paid Advertising since its inception and evangelized its power for targeting specific demographics. However once ads are safely tucked in place, a PPC Manager must grapple with that perpetually-still-making-improvements Ad Manager thingy.
Understanding some corners of Facebook’s quirky paid platform reporting module is essential to optimizing campaigns to keep analytics-focused clients sane and ROI under control. Read on for the latest comprehensive info’ as to what’s hot, not and exactly which reports are currently available (that work) in the ever-evolving web admin’ interface.
Facebook provides an Ads Manager Tutorial. This free.pdf outlines what a 15 year old could figure out in short order and ends with ad-editing. There are a few cryptic resources available from the Facebook’s Help Center, leaving many to ask, “why doesn’t the application work?” There are however some cool analytic insights to be gained once one masters the idiosyncrasies. Here’s the quick and dirty nity gritty.
The campaign page, provides the essentials: Notifications, Daily Spend and an overview of each campaign by Lifetime Stats. Other time options include: yesterday, today, last week but no custom date range.
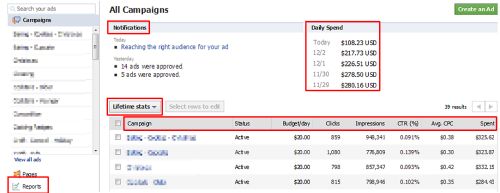
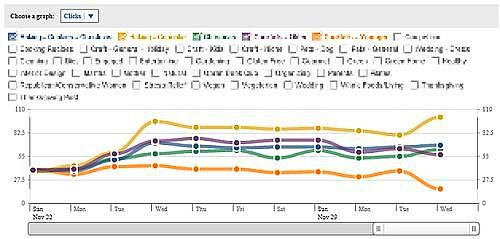
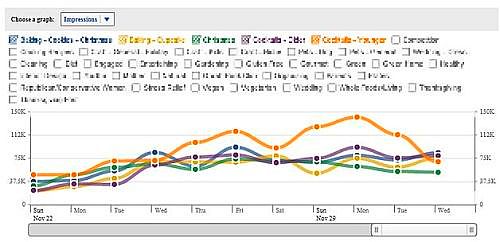
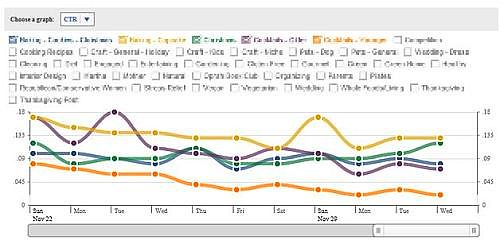
Below the chart of campaigns is a graph displaying one of the three metrics at a time:
Clicks
Impressions
CTR
Facebook lists three different types of reports:
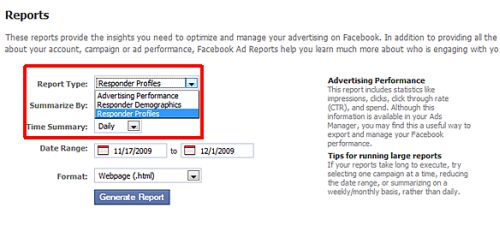
However, Responder Profiles is a bit of a mystery. It didn’t work in two separate accounts and Facebook stopped talking about it. It’s not even mentioned in the Ad Reporting Help Center. Hmm.
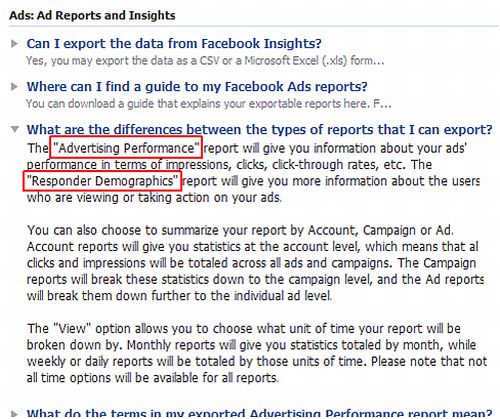
There are two valuable reports you can pull from Facebook: Advertising Performance and Responder Demographics.
Advertising Performance is more nimble than Responder Demographics because you can summarize by entire account, campaign or ads which then allows filtering out ads or entire campaigns.
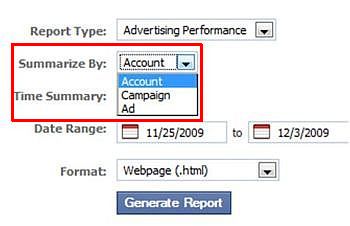
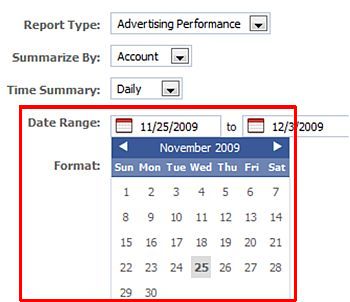
Summarize time by day, week, or month.
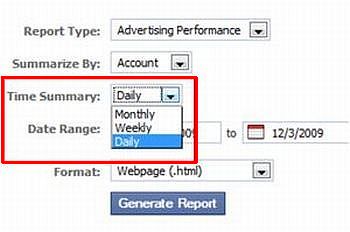
Choose the date range manually.
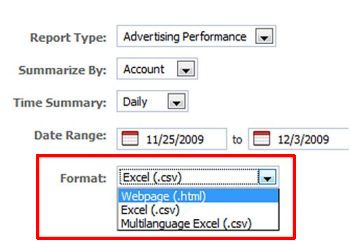
Currently able to export to .csv or webpage (you can also export as a .csv from the webpage view). Facebook does provide the ability to sort individual columns from high to low or alphabetically but exporting to a .csv with pivot tables is most helpful with this basic data reporting system.
Advertising Performance provides Impression, Clicks, Clicks Rate, CPC, CPM, Spend, Unique Impressions, Unique Clicks and Unique Clicks Rate. The Unique statistics are just as they sound, a distinct user, not someone who has clicked on more than one ad from your account.
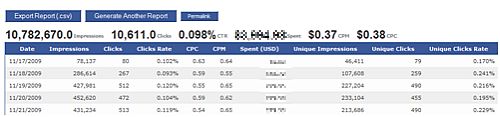
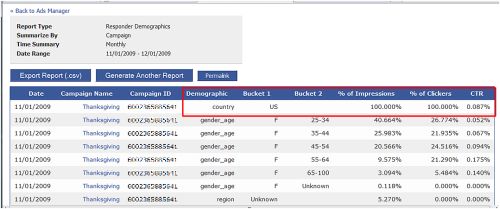
The Advertising Performance spits out essentially the same data from the As Manager Page, but aggregated into nice a .csv which is easier to track performance over time.
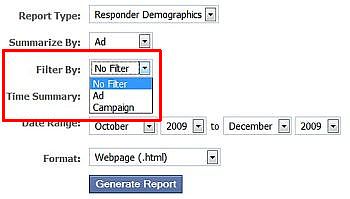
The gem of Facebook Reporting is the Responder Demographics which paints a more intimate portrait of your target audience. Responder Demographics can be summarized by either campaign or individual ad.
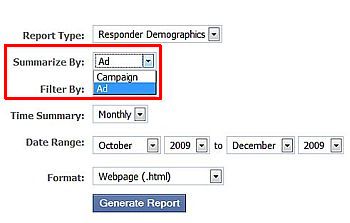
When summarizing by campaign or ad you can again filter out campaigns and campaigns and ads respectively.
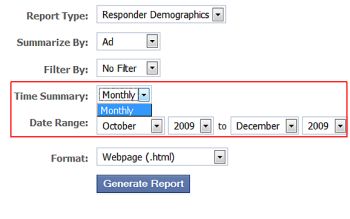
Unfortunately Responder Demographics is not as malleable as Advertising Performance as it only summarizes time by complete months (no mid month reporting).
The columns are self explanatory; however, the “Bucket” columns are determined by the Demographic column. For example, if the Demographic column is “gender_age” the first bucket reveals the gender of the clicker and then the age then the really interesting information is uncovered. As you can see the percent of clickers is fairly spread out among our age groups but those within the 55-64 age group are our best clickers illustrated by the higher Click Through Ratio (CTR).
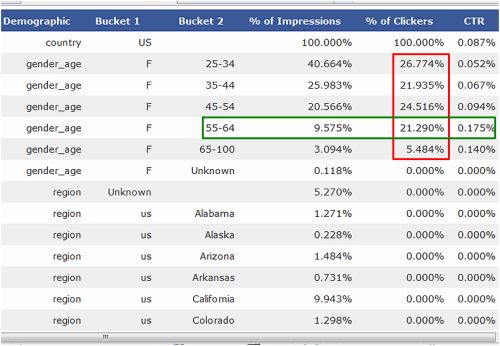
This report will also reveal what percentage of clicks and impressions are coming from which countries you choose to target.
The Demographic column changes to region which breaks down to country (United States) and states. The % of Impression is the user impressions for that specific demographic referenced.
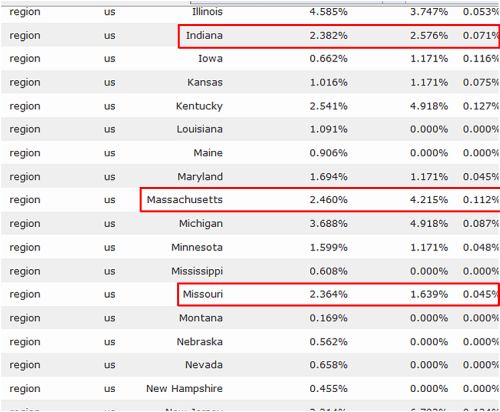
Indiana, Massachusetts, and Missouri all have close to the same amount of impressions; however this data reveals Massachusetts women click far more often than women from Indiana or Missouri.
In conclusion, I.M.H.O Facebook has a lot of room to grow its Ad Manager platform and improve reporting methods. Until then, the basics are what you’ll get with some cool demographic info on the side.


