
![]() When posting videos on YouTube, there’s little more titillating than knowing (with analytic-certainty) that people are actually viewing them. Watching the view-count crank definitely produces a delightful tingly feeling.
When posting videos on YouTube, there’s little more titillating than knowing (with analytic-certainty) that people are actually viewing them. Watching the view-count crank definitely produces a delightful tingly feeling.
When a video is tailored to a particular audience to reach a specified objective, measuring more granular demographic data about views and viewers can be incredibly powerful. Therefore understanding YouTube’s built in analytics, Insight, is imperative. Let’s go on an inside tour of YouTube Insight analytics must-know-fundamentals.
Deeper questions tend to arise at this point. “Who is my audience and how exactly are they discovering my videos?” “Does my content keep viewers attention from beginning to end or are they bailing out midway through?” “Which of my videos are receiving the most ratings, comments and favorites?” “Which related videos is my content showing next to?” Pretty heady stuff…
Enter YouTube’s analytics tool, Insight. This free tool is available to any YouTube account holder who has uploaded video content to their channel. Take a look at what data is just there for the taking:
Date Range
Changing the date range allows you to view content performance across certain parts of video life in each Insight category.
Views
Find out exactly how many views your videos are getting as a whole or individually as a percentage of total views.
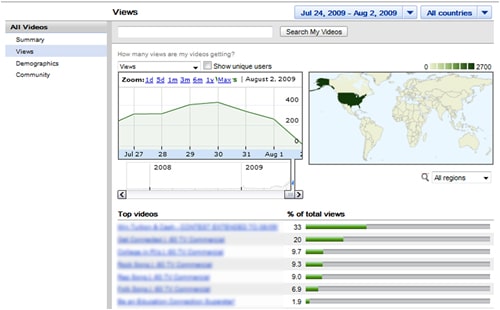
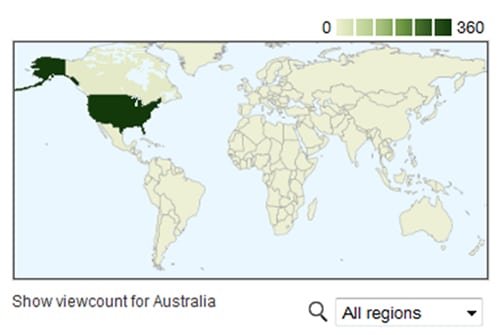
See view count of your videos in different regions across the globe.
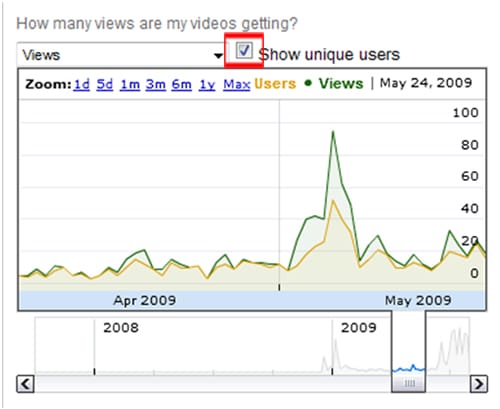
Check the ‘Show unique users’ box in the ‘Views’ tab to see the number of unique views in relation to total views. The difference between total and unique views maybe a reflection of the content’s popularity among users. People’s tendency to watch a video multiple times in one sitting may mean they are sharing with friends or just plain can’t get enough of it.
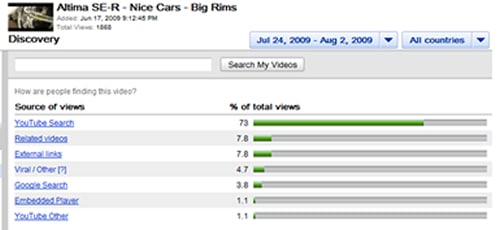
Discovery
One of my favorite areas of Insight, the discovery section reveals the various sources of traffic to your content. Find the spectrum of keywords and phrases that are driving views as well as related videos your content is appearing next to. Also available is the percentage of total views received by embedded players, external links, Google searches, viral means and other YouTube pages.
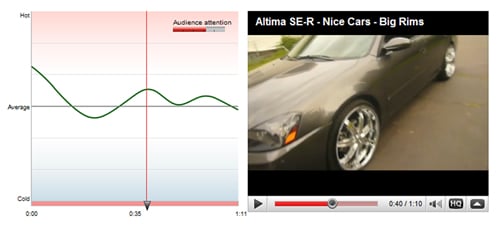
Hot Spots
Audience attention is recorded to illustrate a video’s rate of retention in relation to videos of comparable length. High points in the graph may reflect parts of the video that viewers are rewinding to see again. Experiment with catchy annotations designed to preview a particular part of the video in order to keep the viewer engaged (ex. wait to see what happens at the next!). Then monitor any shifts in audience attention that may have come as a result of the message.
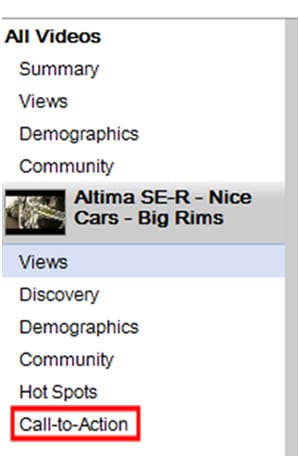
Call-to-Action
Formerly only available to non-profit organizations, call-to-action overlays allow you to place an external link over your video thereby driving traffic to your channel profile or website. Find the number of clicks your call-to-action overlays have received for a particular video in the call-to-action tab.
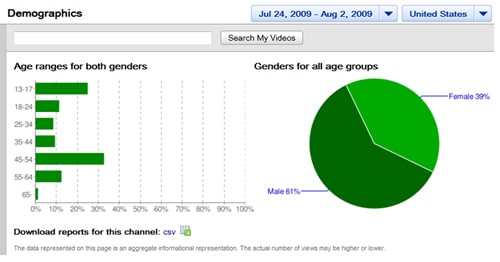
Demographics
Insight relays age range and gender of your viewers either for a specific video or across all published content.
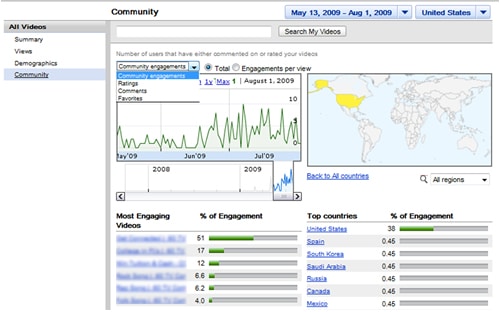
Community Engagement
The community engagement tab shows the number of comments, ratings and favorites your videos have received as well as the percentage of engagement in different regions of the world.
Pulling Data
Download all or segments of the gathered data into a .csv reports for an even deeper and more detailed look into video performance.
Ensuring your video reaches the right audience is a demanding and ongoing process. Luckily YouTube has provided several different metrics with which to gain a better understanding of how your content is being viewed. It’s important to understand that the metrics gathered are just that, metrics. The true benefit comes from using the data to understand changes and opportunities that may be inferred within the pretty graphs and percentages.


